

The Guide to the Data on Outperformance
We have finished the guide, it is delicious, and there were some surprises

Hello Investing Friend!!
Happy Labor Daybor Neighbor!!
I hope you had a terrific long weekend.
If not, I intend to help you have a great short week!!
Because – It. Is. TIME!!

The Guide to the Data on Outperformance is here!!
My investing friend, we now have financial weapons of mass outperformance at our disposal!!
And, as you know, outperforming can make all of our financial dreams come true:
That’s why we are already outperforming together.
We are currently compounding at 36.7% annually (25.6% after 8.75 months vs 6.6% for the S&P 500).
So let’s keep it going for decades by having the data guide us into the highest probability opportunities and actions/inactions.
Per the data gleaned from rigorous studies, there are twelve keys to outperforming.
The first four concern how we should construct our portfolios, and what we should and shouldn’t do.
The last eight are about identifying the right stocks.
The Twelve Data-Driven Keys to Outperformance are:
We Must Outperform for Ourselves – Managers Cannot Do This for Us
Concentration Rather Than Diversification
Investing $100M or Less (2018 Dollars)
Low Turnover Rather Than a Lot of Trading
Research and Development – Successful and Illiquid
High Profitability – Especially in Free Cash Flow, Smaller
Growth – Especially Assets, Cash, and Free Cash Flow
Price Action – Big Drawdown, Momentum, a Dip, and Window Dressing
Obscurity
Value – After Accounting for Intangibles
Relatively New Firms Rather Than Old Stodgy Firms
Founder/Owner-Operator/Family Run
Alrighty investing friend – let’s put on our outperforming goggles and dive in!!
1) We Must Outperform for Ourselves – Managers Cannot Do This for Us
Outperforming is spelled DIY – you must do it yourself.
That is because money managers have misaligned incentives for two categories of reasons:
Their compensation is mostly tied to growing assets under management, which we will see flies directly in the face of outperforming
They are heavily incentivized and also mandated to diversify, which again flies directly in the face of outperforming
This data comes from the Best Ideas paper from Harvard Business School and the London School of Economics we recently wrote about.
That same paper, though, shows us that we can in fact outperform.
The study re-imagines how managers would have performed if they invested in their top ideas, and did not diversify. And…
They outperformed.
So can you and I. But managers cannot do this for us.

2) Concentration Rather Than Diversification
To outperform we must concentrate in winners, rather than diversify.
That is because the stock market is remarkably skewed. The big winners win huge, and most stocks should just be avoided.
In fact, between 1926 and 2019 the US stock market made $47 Trillion. Half of that came from just 83 stocks:
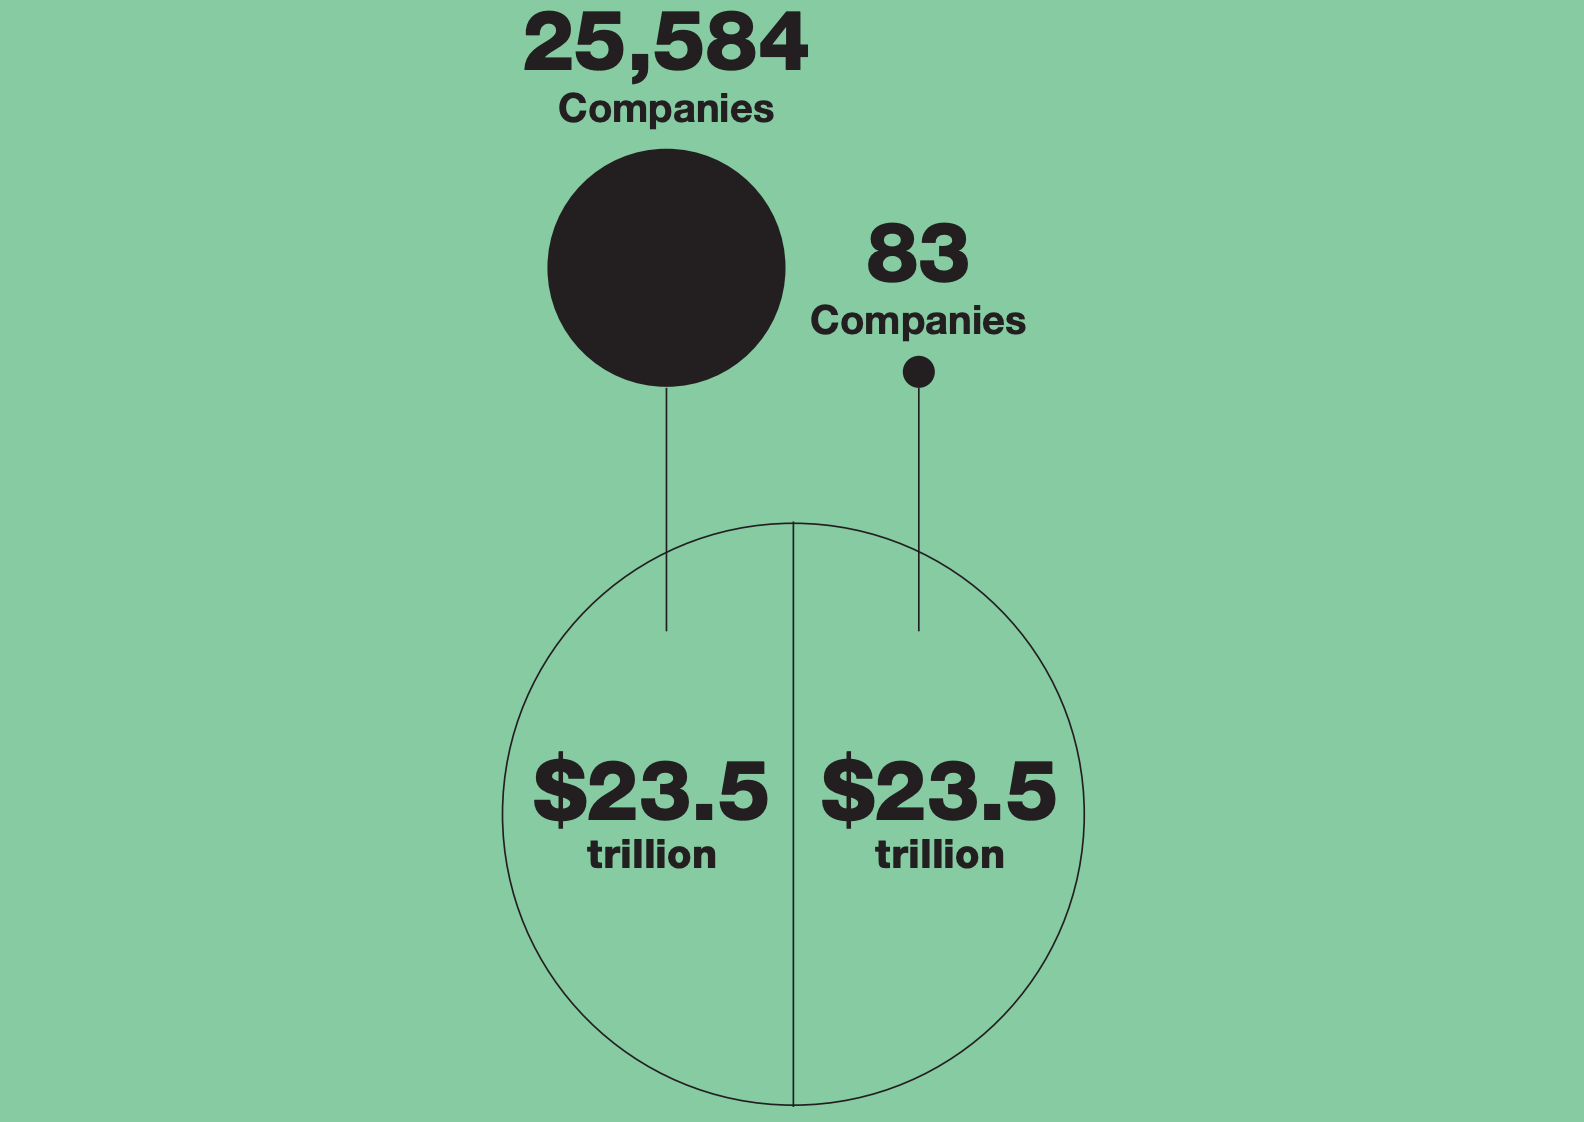
This is work done by Hendrik Bessembinder, sponsored by an investing firm made up of investors investing their own money – Ballie Gifford.
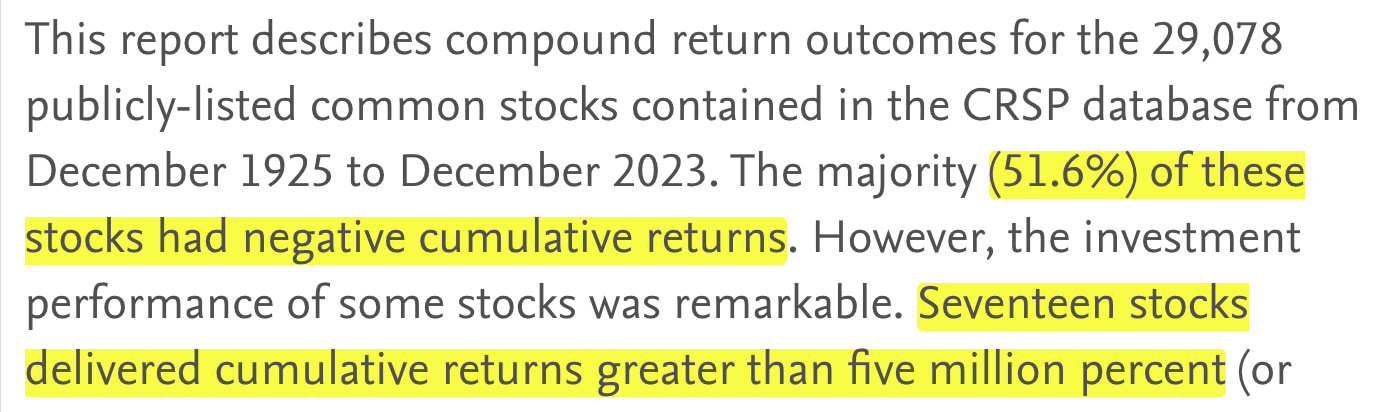
In another study of his published less than a year ago, he shows most stocks lose money(!!), while just a handful absolutely crush:
And the idea that concentration is key has been demonstrated before:
So we are hunting for the HUGE winners, and we are actively trying to avoid the toxic waste.
So how many stocks should we have to be concentrated in winners and not diversified in waste?
Can we sneak some diversification in there and still outperform?
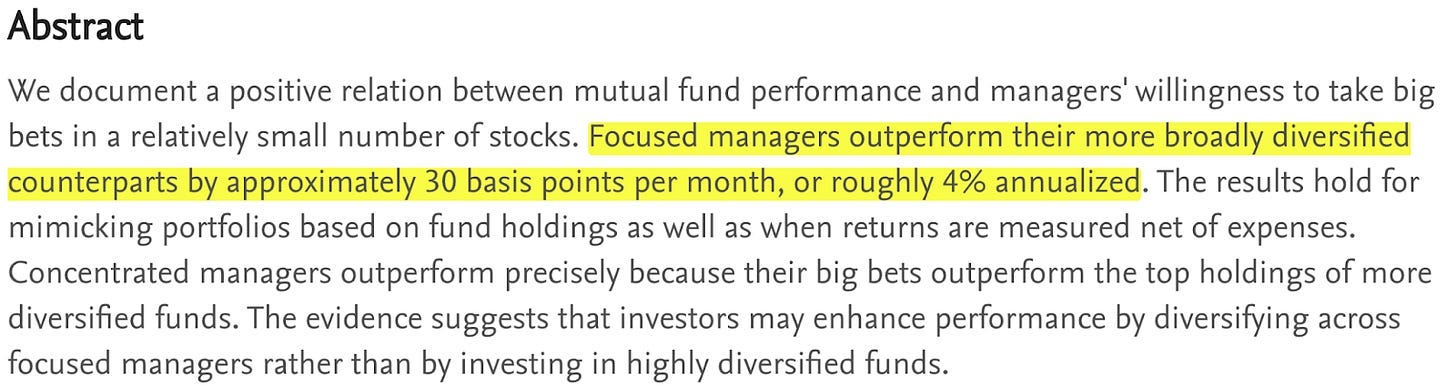
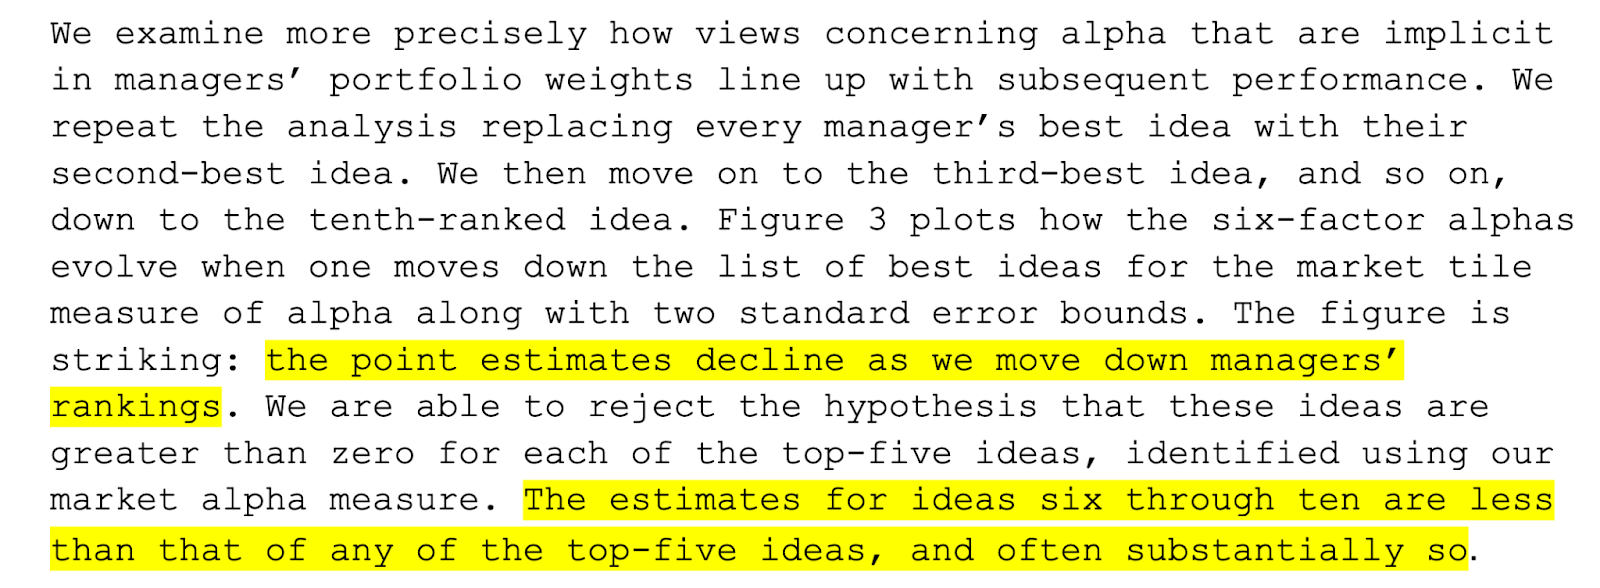
Well, the Best Ideas study looked at the top ten ideas of each manager. So, we can have as many as ten stocks and still outperform.
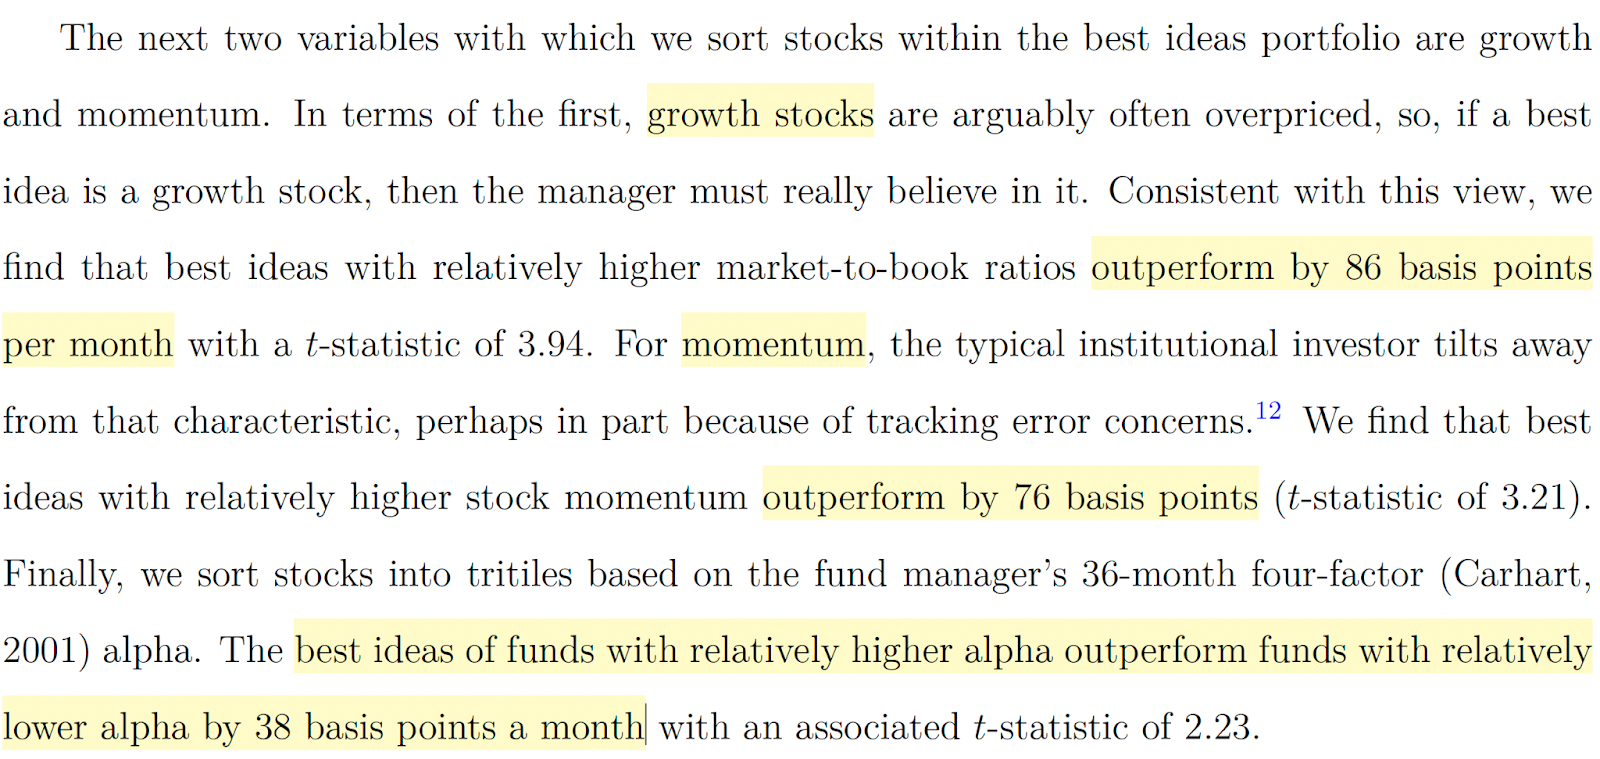
But note well – the managers’ top ideas performed best, their second highest conviction ideas performed second best, and so on. And their top five beat their top ten:
And that lines up with what studies of stock diversification tell us.
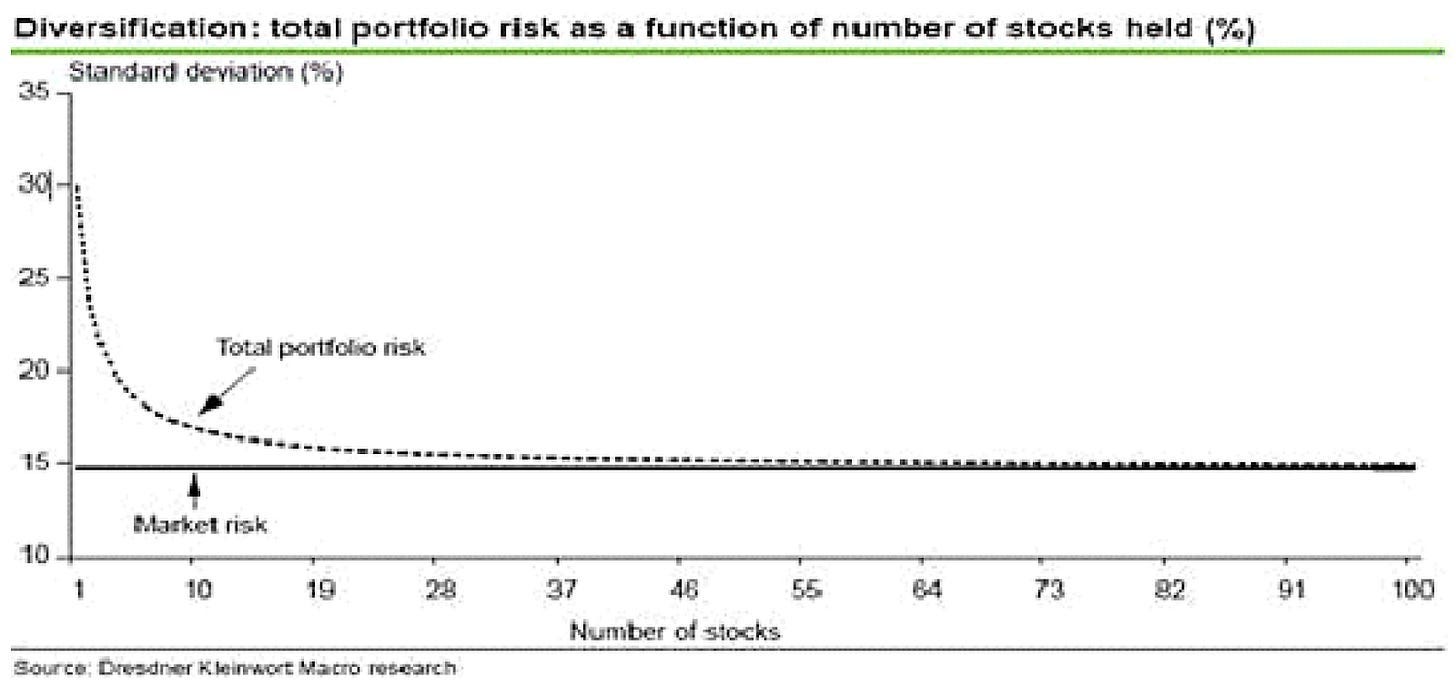
These studies show that after about eight stocks each additional stock does not add much more diversification benefit.
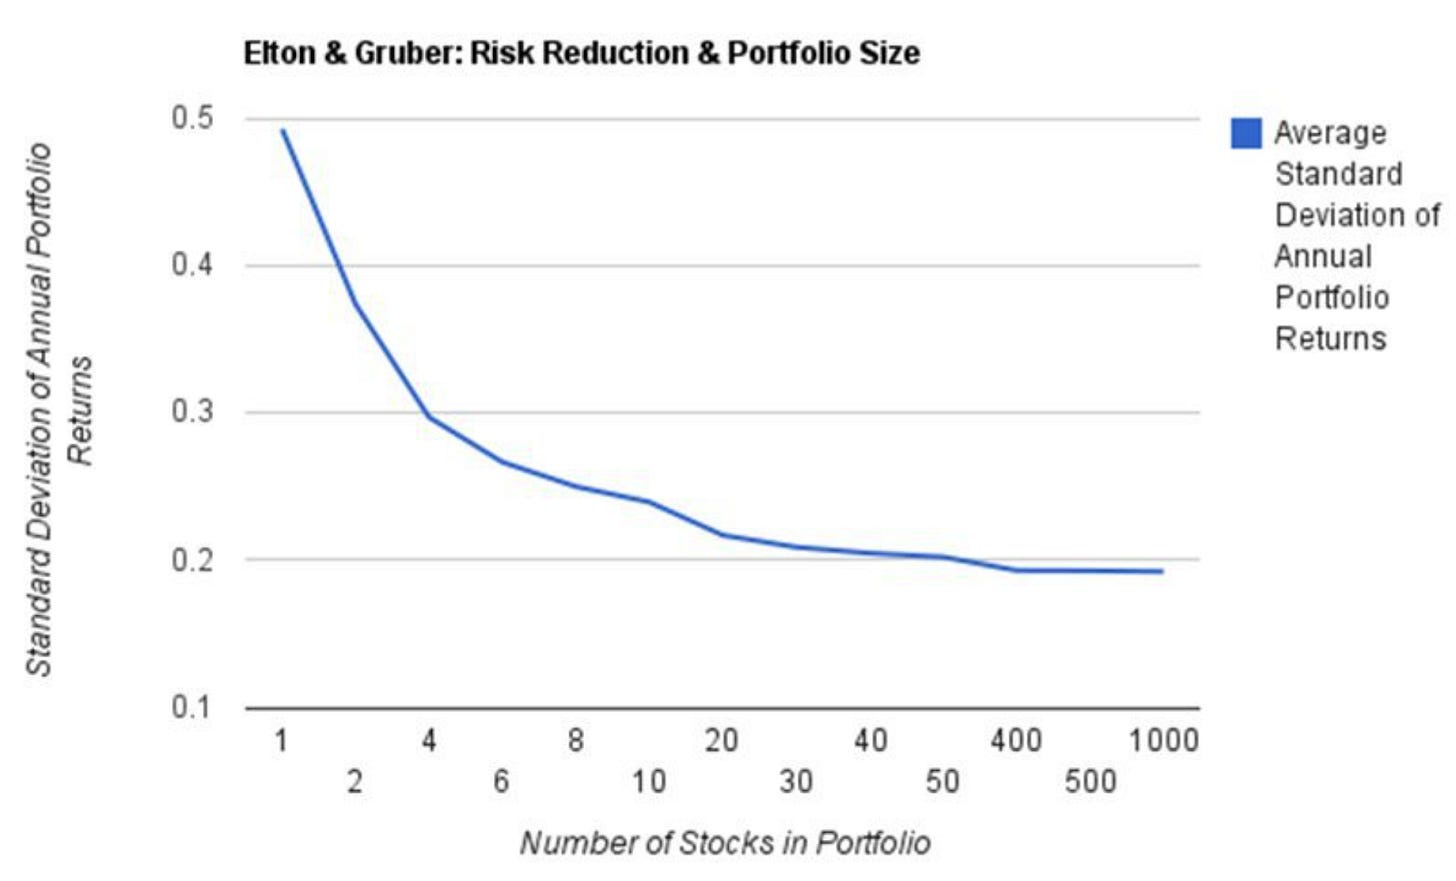
And after about four stocks, we have already gotten most of the benefits of diversification:
Another view, similar results:
So it seems that if we have one to three stocks we are concentrated, and that possibly could be stretched to seven. At eight we are diversified, and are not concentrated anymore.
And as we have seen – the big winners are rare, we should be sticking with our best ideas, which are more likely to win.
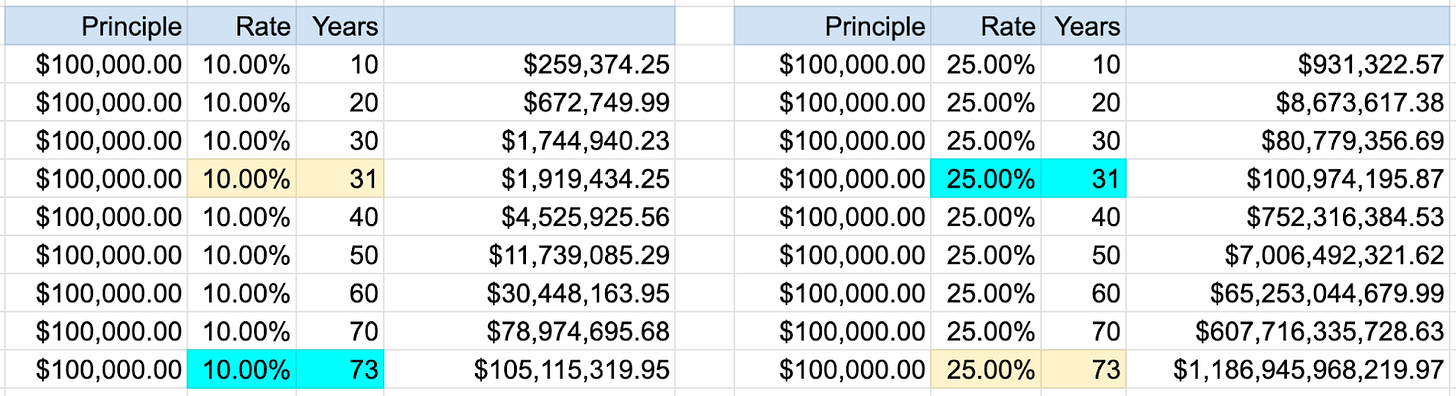
So to outperform we should limit ourselves to seven stocks maximum, and we should aim for a limit more like three or five.
“Very few people have gotten rich on their seventh best idea”
– Warren Buffett, University of Florida
3) Investing $100M or Less (2018 Dollars, About $129M Now)
“Small” amounts of money mean a wide range of stocks on the menu from which to choose.
Small amounts of money also allow us to be nimble.
From the Best Ideas study, small amounts of assets under management are a major predictor of strong outperformance:
That is, in fact, remarkable.
And encouraging.
So before about $129M we have a terrific edge.
And we should exploit it by aiming to outperform.
Down with indexing!!
4) Low Turnover Rather Than a Lot of Trading
You may have heard that most traders lose money. At very least, they underperform.
One study shows that active traders underperform by about 6.5% annually. Another shows active trading managers underperform regularly (not to be confused with “active share” meaning holding obscure stocks). We will see another reinforcing study on trading frequency when we talk about obscurity.
But this ties in with what we already know – there are a few enormous winners out there. All we have to do is find them, then let them carry us. At least for a while.
5) Research and Development – Successful and Illiquid
Now we are into the fun stuff – hunting for the best stocks in the world.
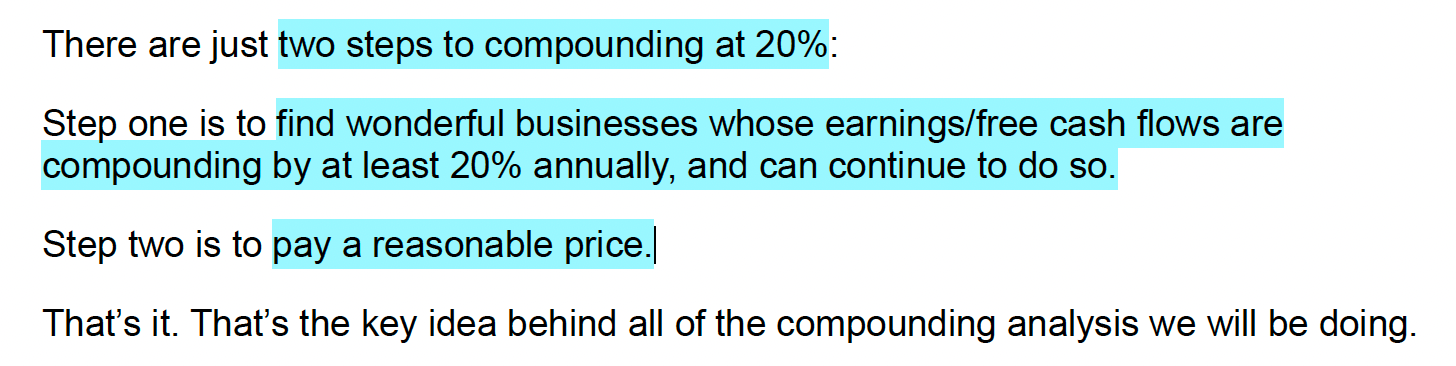
And that brings us to one of the most important factors that an outperforming stock can have – high spending on research and development.
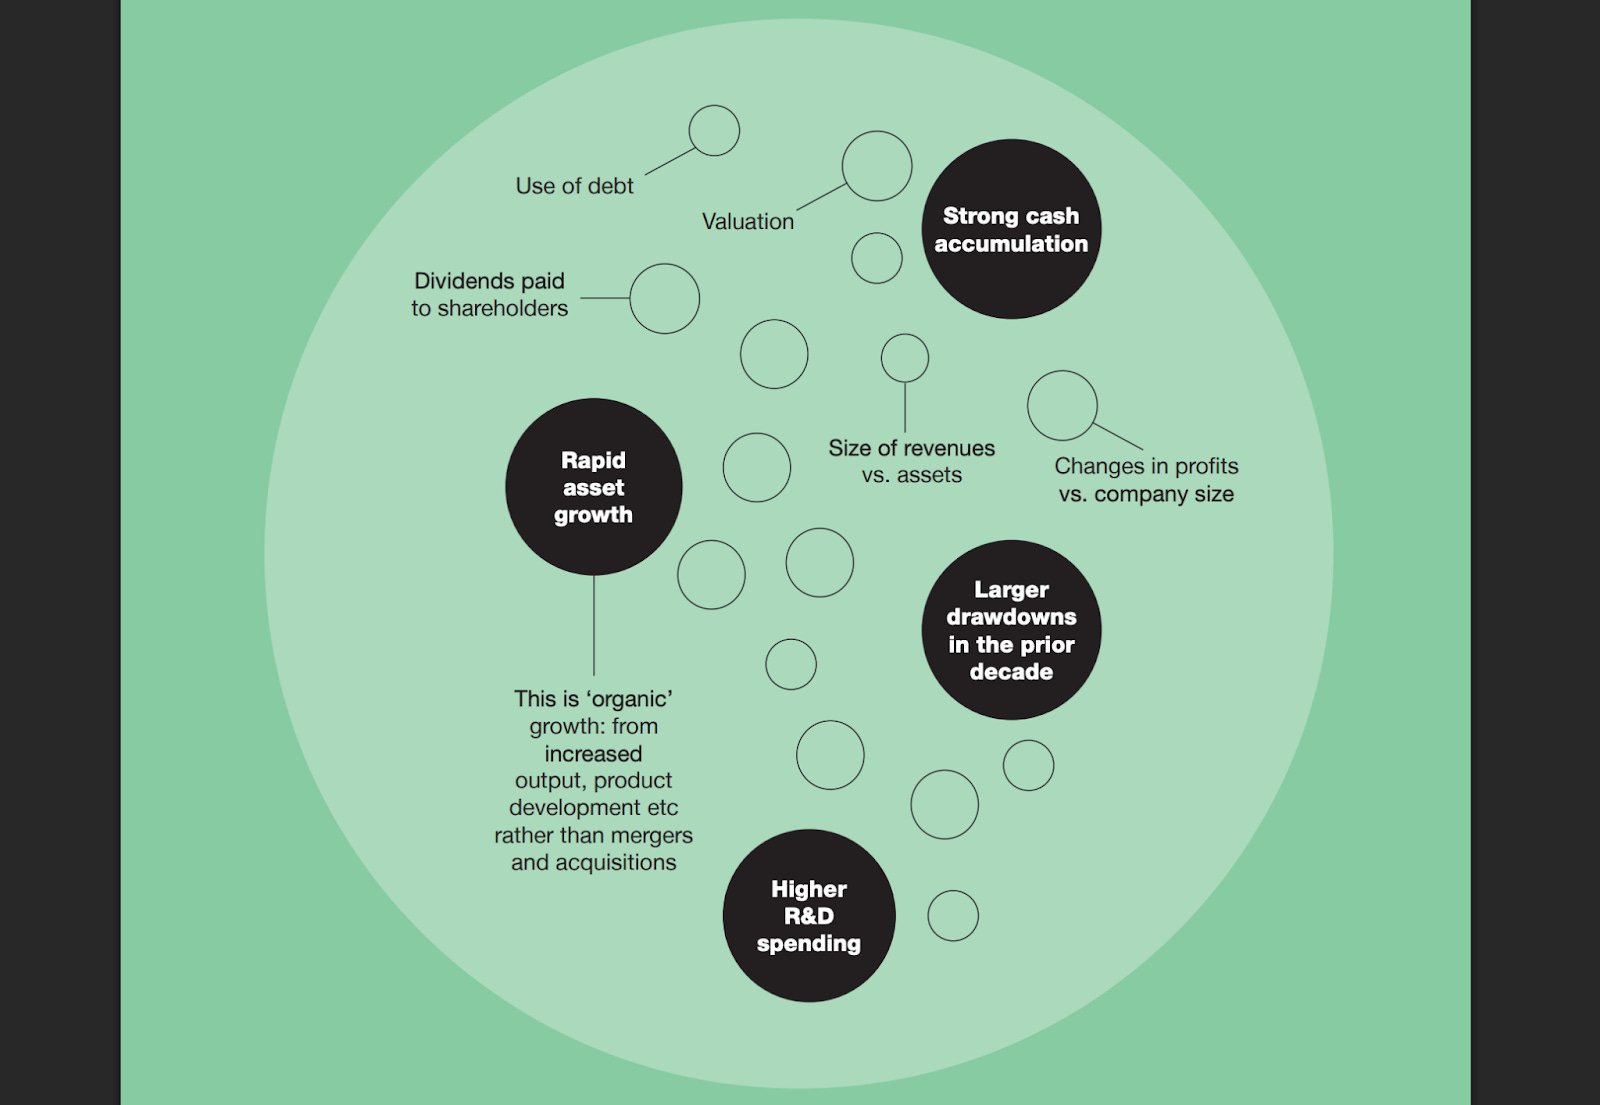
According to Bessembinder’s work, higher spending on R&D is one of the four statistically significant factors in wealth creation (he examined 22 factors in 26,285 stocks from 1950 - 2019):
R&D is reinvestment in the company, one of the most important traits that we are looking for.
Let’s remember (from when we launched our portfolio):
And as we illustrated with a story from uncle Warren:
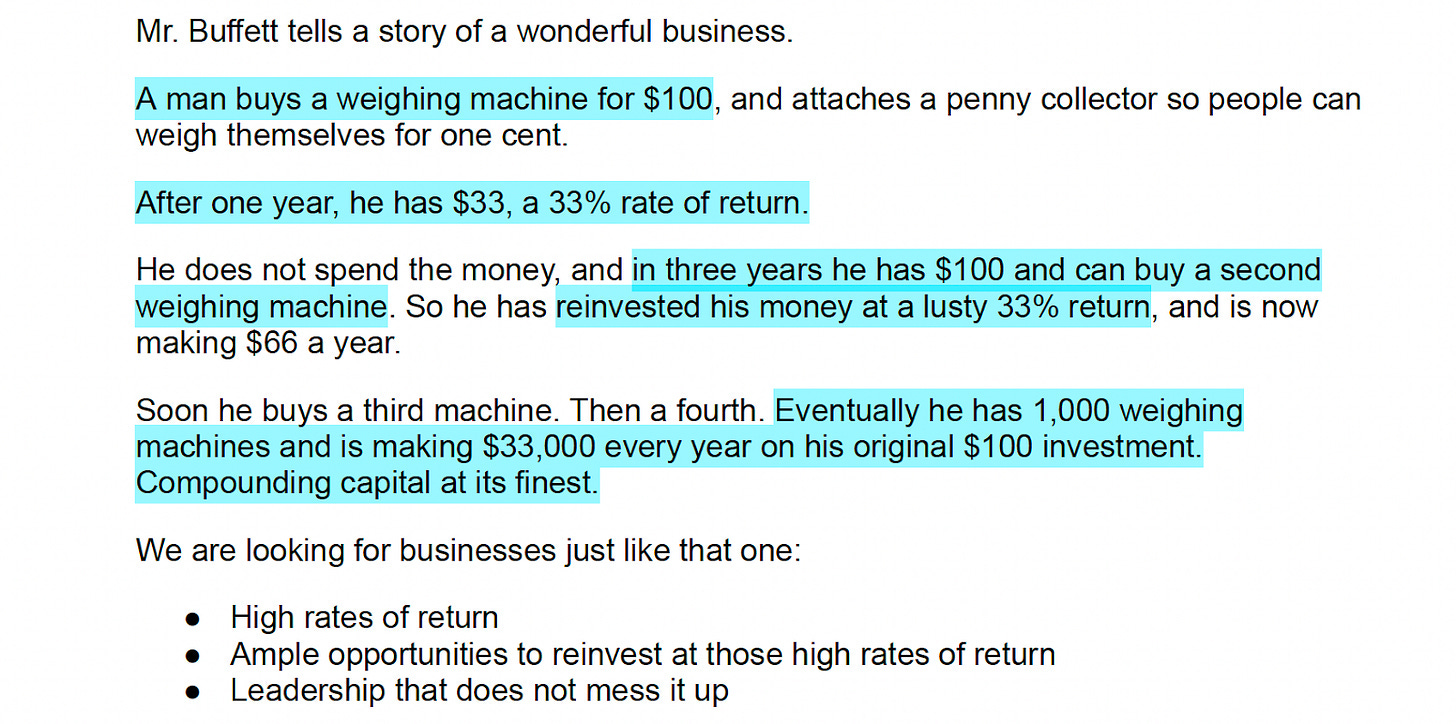
So that’s what companies that are doing R&D the right way are doing, reinvesting at high rates.
Now, again, we are identifying the characteristics of the very best stocks.
So even though the very best stocks have a lot of spending on R&D, most companies cannot do R&D well, and actually should not do it!!
So it is not enough to see high R&D, there are two accompanying keys we should look for.
One is past success.
Some companies can show a robust ability to continue to get high returns when they invest in R&D:
The other accompanying factor is illiquidity.
The Best Ideas study notes illiquidity as an independent factor for outperformance.
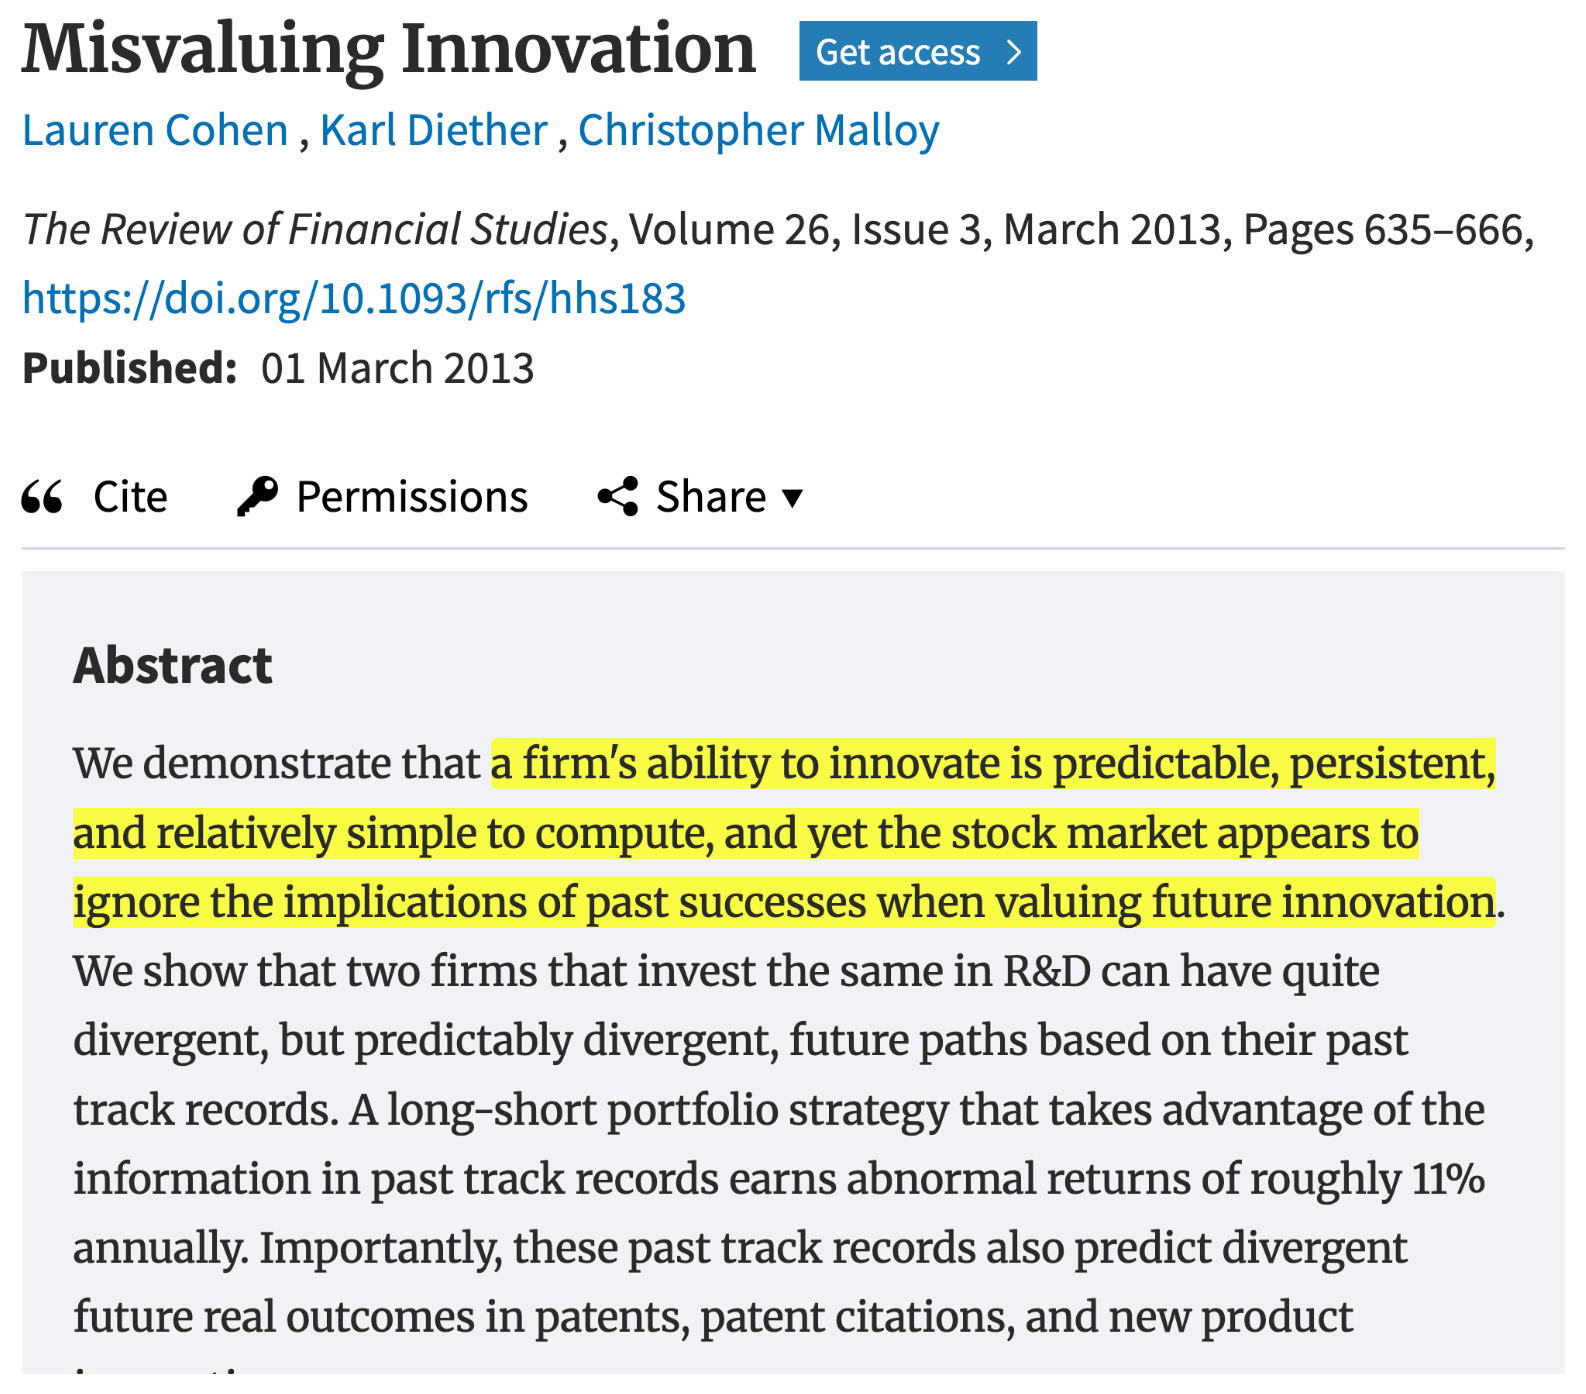
But that can be refined further – illiquidity seems to work specifically by predicting more successful R&D (Journal of Money, Credit, and Banking, 2023):
This is perhaps because these illiquid stocks may be more likely to avoid the “institutional imperative” of doing what others are doing for appearances or defensive reasons.
So that is what we are looking for – a successful record of high returning R&D, especially in illiquid stocks.
Also, we saw that “high asset growth” is one of Bessembinder’s four statistically significant keys. That often follows from successful reinvestment in R&D.
And, we note that the Best Ideas study and other esteemed researchers like Jensen also echo the importance of reinvestment for outperforming stocks.
Finally, how do we know if a company is reinvesting well?
Check out my previous report on ROIC and its considerations.
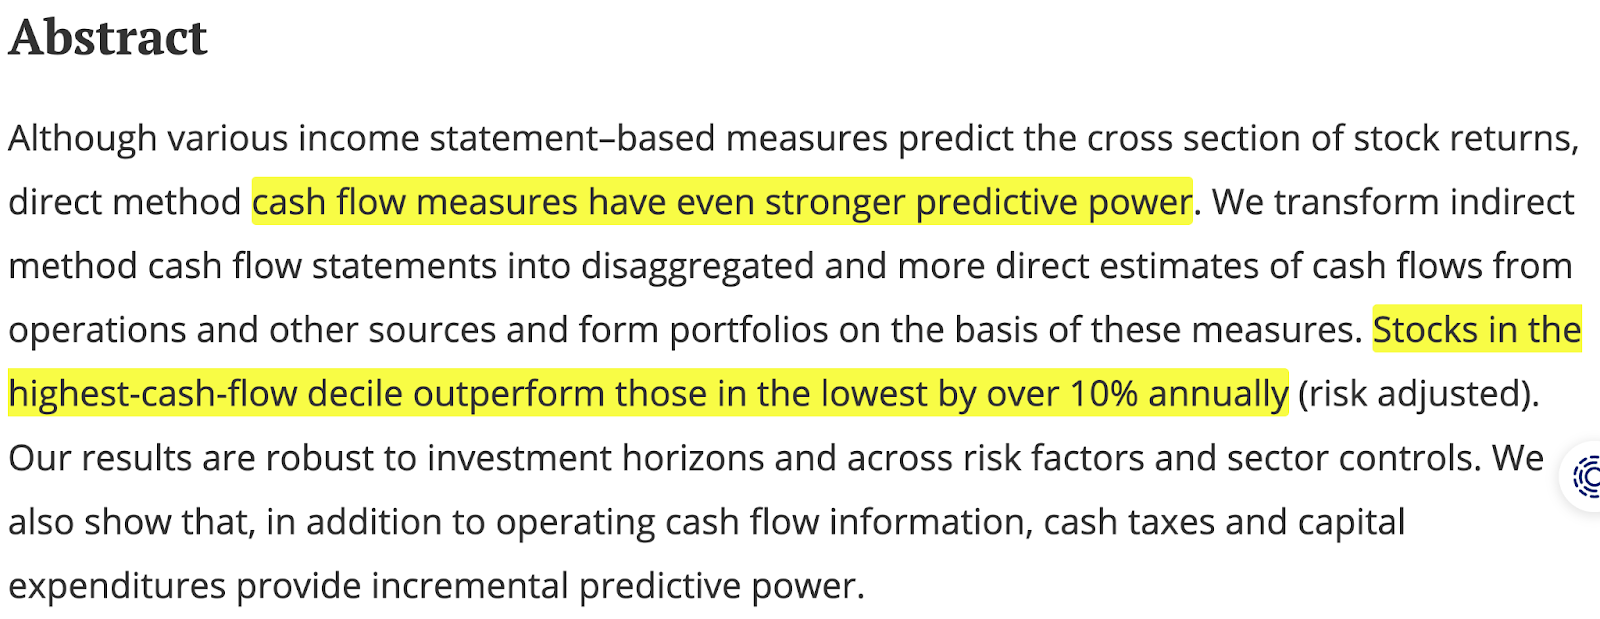
6) High Profitability – Especially in Free Cash Flow
We saw that “high asset growth” is one of Bessembinder’s four statistically significant keys, and that is especially the case when the asset that is growing is cash (another of the four keys).
One way to grow both of those is to be highly profitable.
Best Ideas agrees:
And Fama and French had to update their model to include profitability.
Again, things like ROIC are a good way to measure this.
Why are measures of return so important?
We saw the story of the high-return weighing machine business.
Charlie Munger echoes the importance of high returns (USC speech):
"Over the long term, it's hard for a stock to earn a much better return than the business which underlies it earns. If the business earns 6% on capital over 40 years and you hold it for that 40 years, you're not going to make much different than a 6% return—even if you originally buy it at a huge discount. Conversely, if a business earns 18% on capital over 20 or 30 years, even if you pay an expensive looking price, you'll end up with a fine result. ”
And, let’s note that profitability and successful reinvestment are the hallmarks of quality.
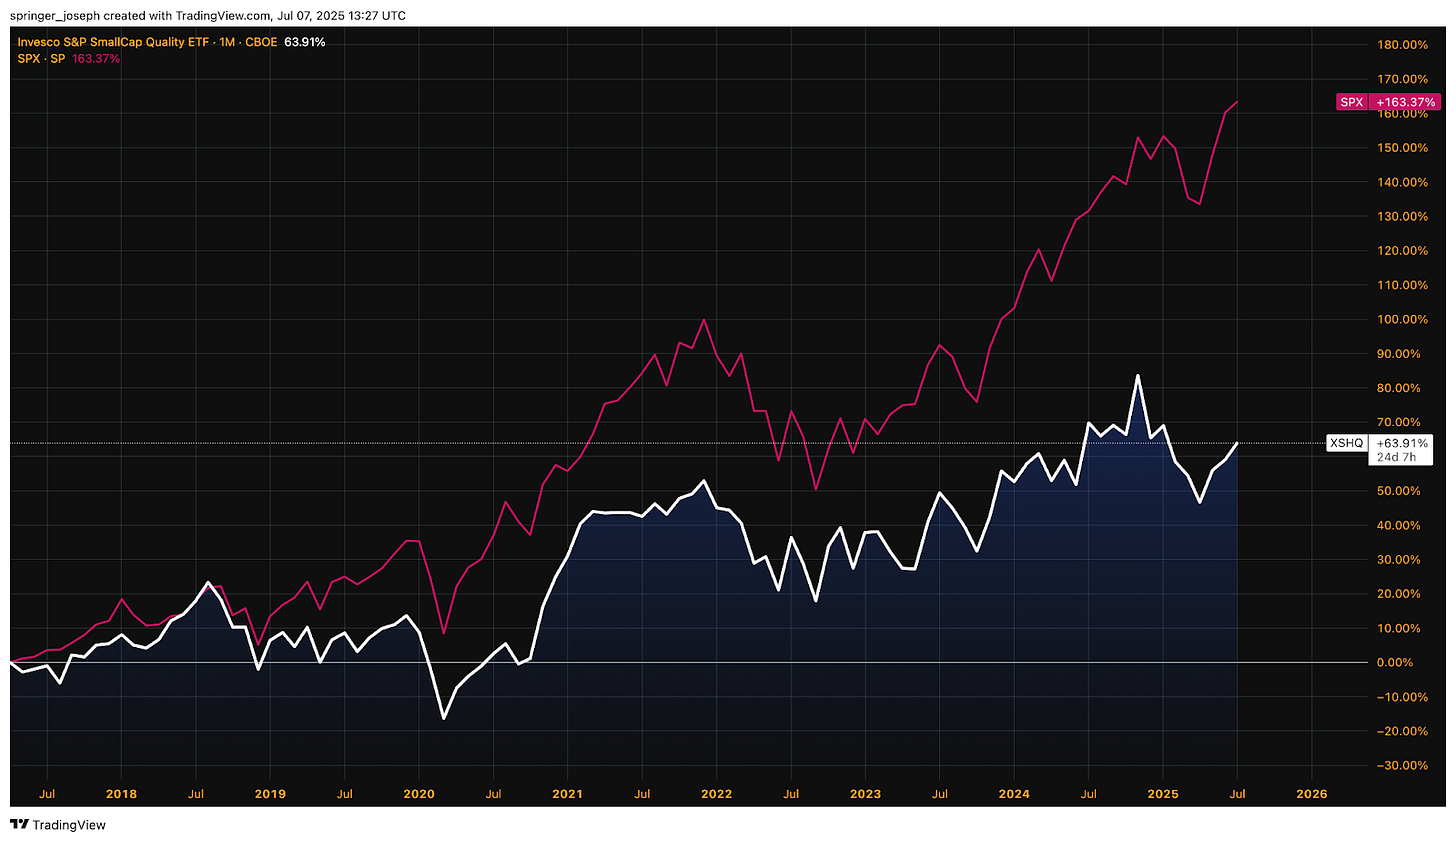
And quality works especially well in the small stocks:
But concentration is key here, as is obscurity. This is demonstrated by the Invesco S&P SmallCap Quality ETF (XSHQ), which has underperformed badly:
So we are looking for highly profitable stocks, especially as measured in ROIC (with an eye toward FCF), asset growth, and cash growth, and especially in the smaller stocks.
7) Growth – Especially in Assets, Cash, and FCF
Continuing with growth, Best Ideas noted growth as its most important factor for individual stocks:
And we saw that Bessembinder notes the two most important aspects of growth to look for are assets and cash.
And to get growing cash on the balance sheet, we of course want free cash flows to be growing.
From the Financial Analysts Journal:
And the Journal of Financial Research:
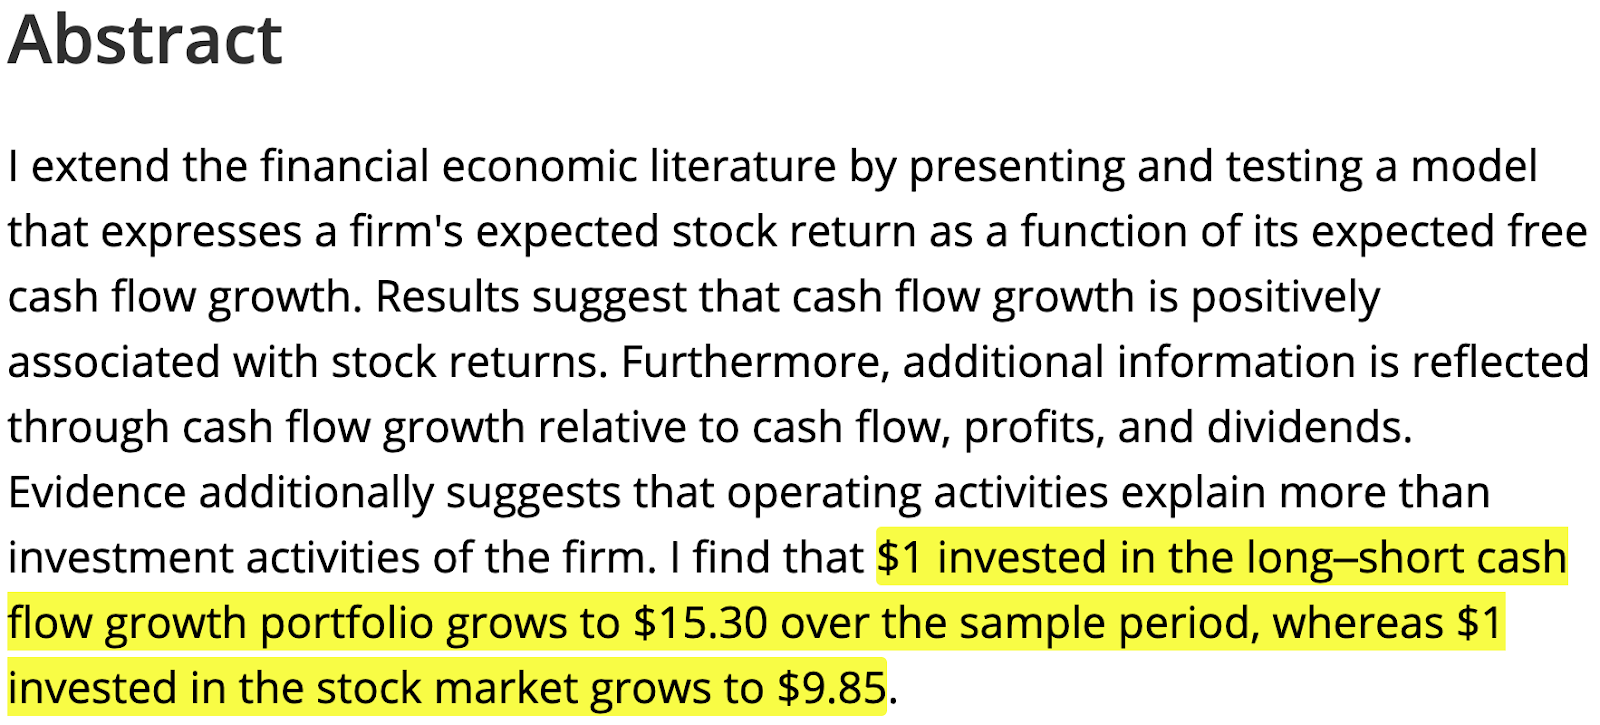
Note this last study states that operations are more important than reinvestment.
Let’s temper this by saying this is for the average stock, not necessarily the big winners. And let’s also reaffirm the importance here of profitability – a strong measure of operations.
If you click the link for the ROIC report, you can see how to adjust ROIC for Research & Development, Free Cash Flow, Stock Based Compensation, Asset Growth, Incremental Returns, and more. This gives us perhaps the best statistical look at profitability.
And let’s again remember the “strong cash accumulation” factor that Bessembinder emphasized. This should be the end result of good cash flows.
Alrighty, so sales and earnings growth is good. But more importantly we should be looking at the growth of assets, cash on the balance sheet, and free cash flows.
8) Price Action – Big Drawdown, Momentum, a Dip, and Window Dressing
Bessembinder’s fourth statistically significant key is interesting – a big drawdown in the past decade.
That means that the market was once excited about the stock, then it got destroyed, and now it is drastically cheaper.
Sounds like a good set-up.
So should we buy every falling knife?
No.
In addition to applying our other twelve keys to outperformance to find the right bargains, we can use the stock price to let us know when the coast is clear.
Here we are looking for momentum over three and twelve months.
And if we get a one month dip, while staying positive over three and twelve months, that is better still.
Momentum has been well documented across numerous asset classes and geographies.
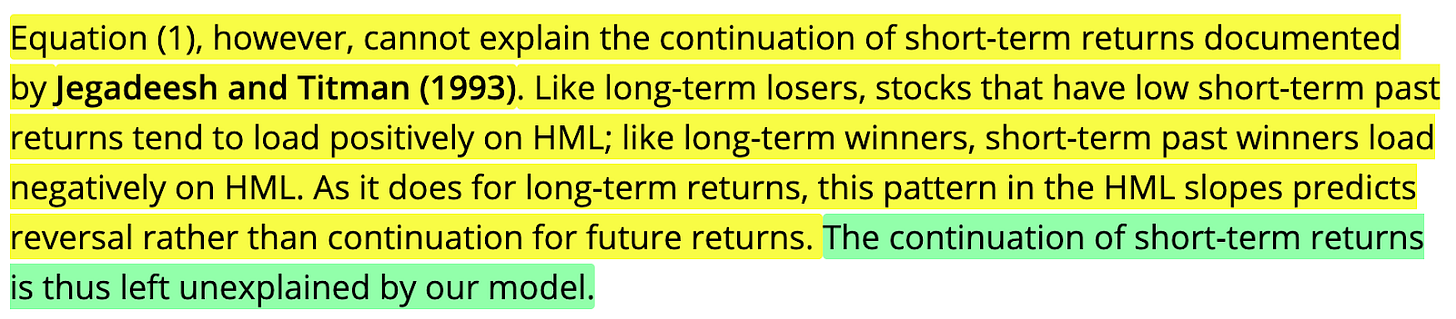
Fama and French had to update their updated five factor model to account for it:
And another interesting wrinkle for momentum is window dressing.
Look how green the last week of the quarter is – and how red the first week is:
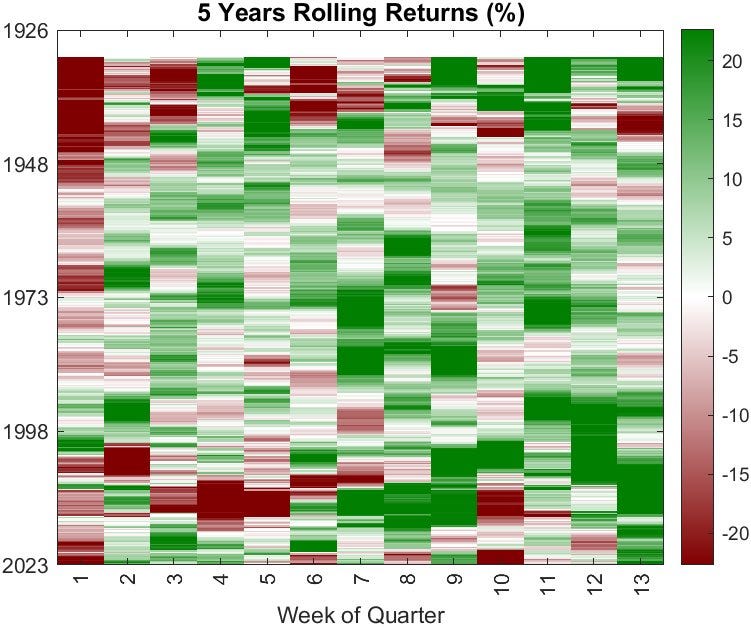
This is managers buying the winners, so they can show their clients that they own them at the end of the quarter.
Then, as we can see, they dump them once the next quarter starts.
So we especially want to own momentum stocks the last week of the quarter. Not so much the first week.
And that one month dip that does not break the three and twelve month streak is called a “short-term reversal” and a buy, per the Jensen paper.
So when we find a stock that has been killed, but then the market likes it again on both a three and twelve trailing month basis, and we get a short-term one-month reversal, AND it's the beginning of the last week of the quarter – that is the best “buy” signal we can get from the price action.
9) Obscurity
We don’t want to own what everyone else has in their 401(k).
Instead, we should favor obscure stocks – we want to look off the beaten path.
This is shown in the “active share” measure of funds. Active share is what percent of the portfolio differs from the benchmark. So if the benchmark is the S&P 500, and the fund’s holdings overlap 40%, its active share is 60%.
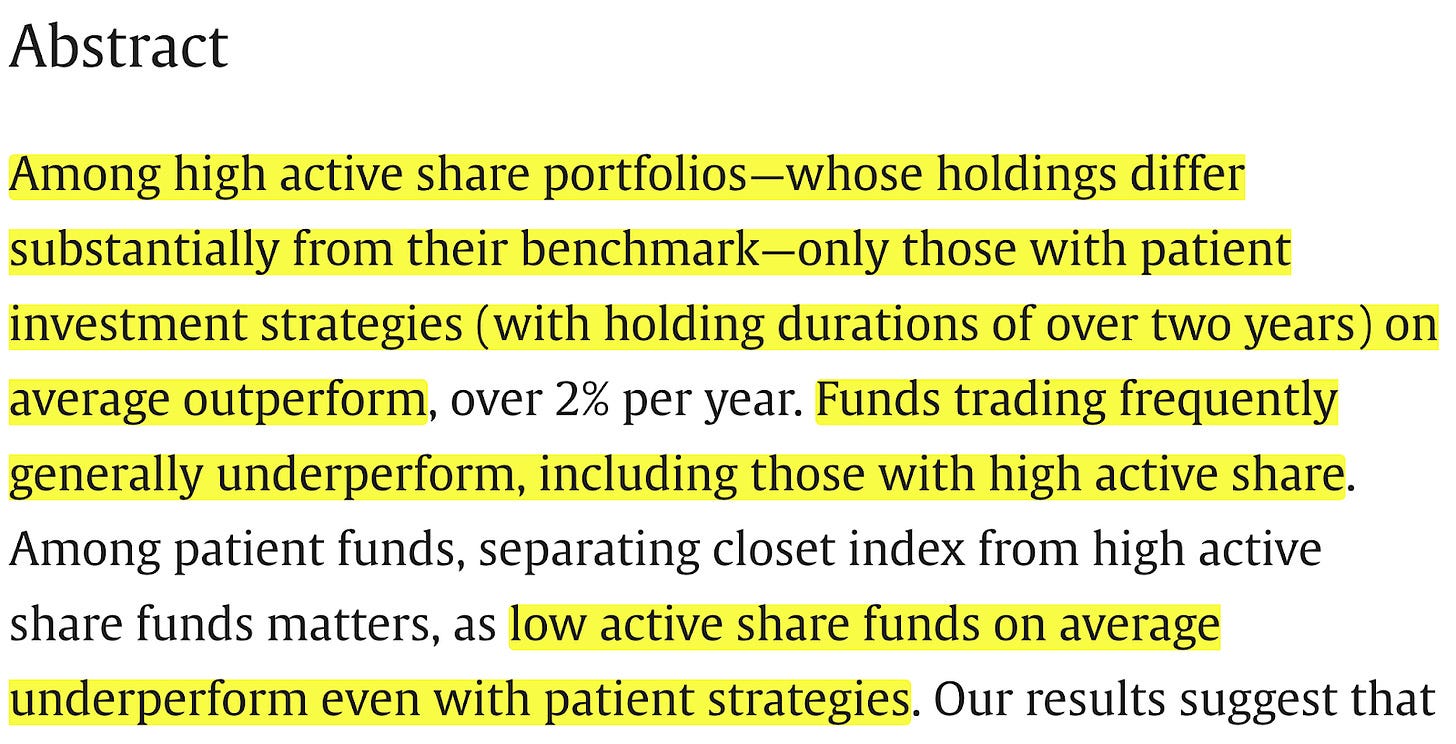
Active share predicts some outperformance, provided the holdings are held long term and there is little trading in the portfolio:
…
So we should buy and hold obscure stocks that have all the other key characteristics – and let the compounding happen.
10) Value – After Accounting for Intangibles
Value used to “work”.
That is, by comparing the value of the assets on a company’s balance sheet to the value the market was currently assigning it, values would emerge and could be exploited.
The problem is, companies used to have profit generating assets on their balance sheets like mills and plants. Now, many of the best companies generate their profits from code that is simply not accounted for on the balance sheet at all.
And that is why value seems to have stopped working.
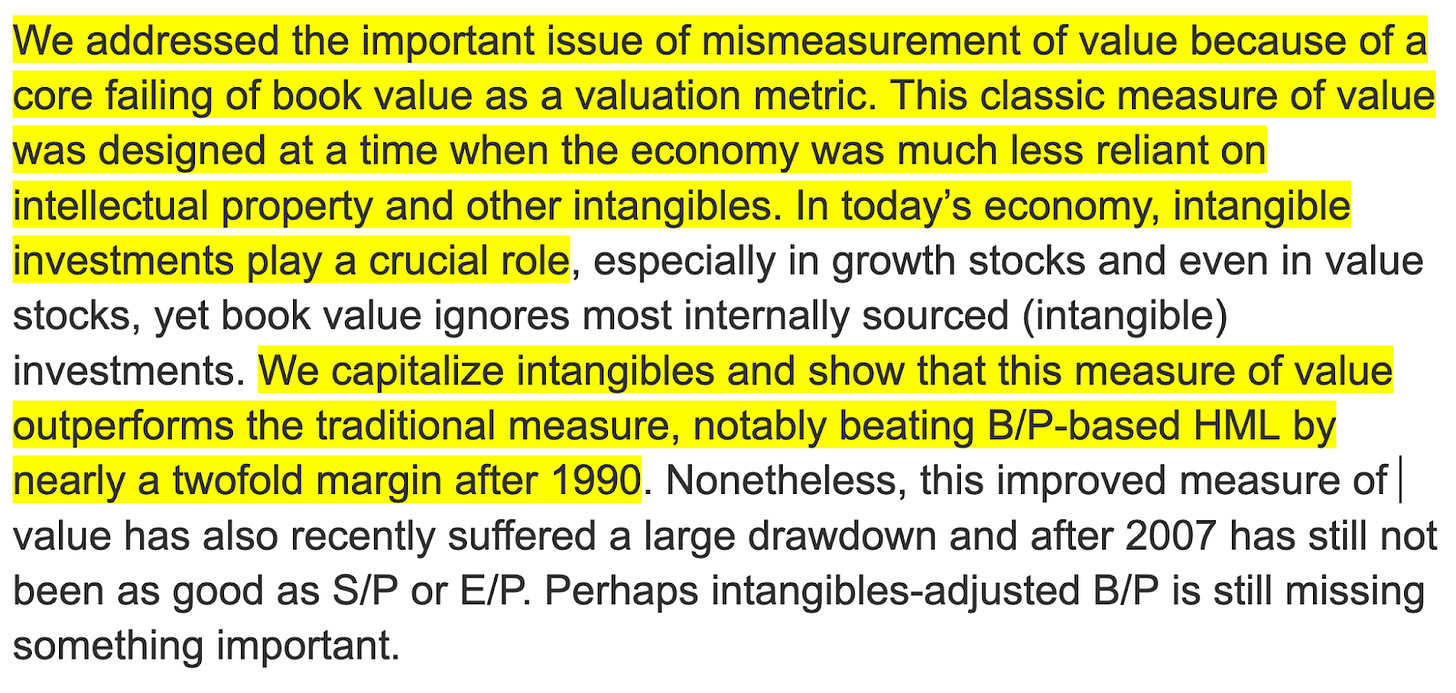
But, what if we did the work of capitalizing these intangibles. That is, account for them on the balance sheet?
Why, then it would be revealed that value never stopped working at all:
We are doing this, at least somewhat, when we add back the R&D spend in our calculations, as well as account for equity.
Identifying successful R&D in asset-light companies (software for example) is another way to pin these stocks down.
11) Relatively New Firms Rather Than Old Stodgy Firms
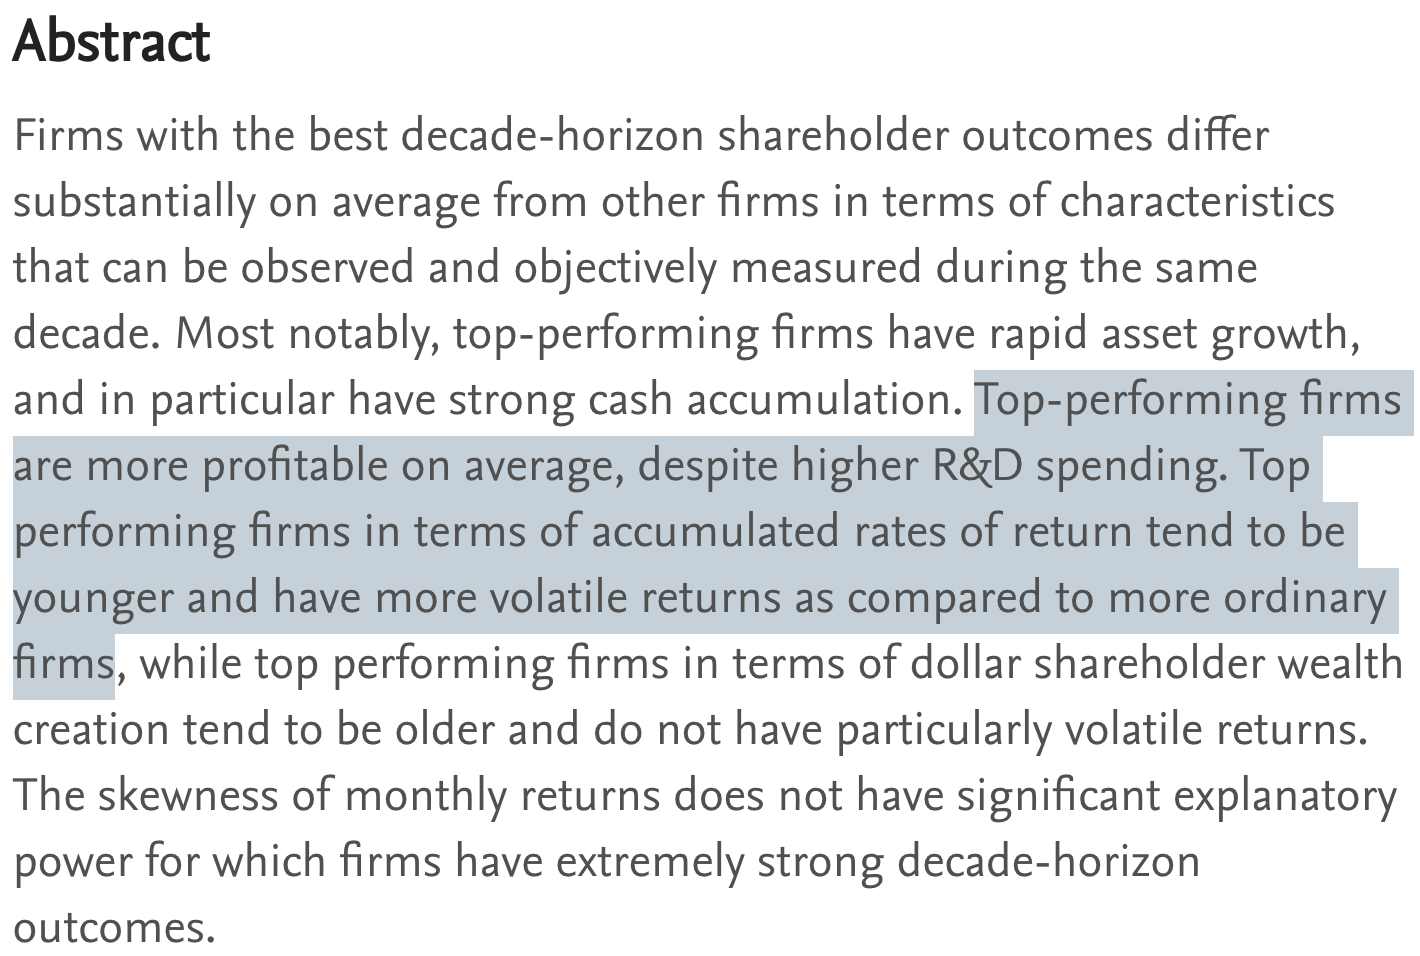
Unsurprisingly, the best performing stocks tend to be found amongst relatively new companies, rather than older firms.
With this youth comes relative volatility of returns. So we are in fact not looking for low volatility stocks, after all.
This comes from Bessembinder, again:
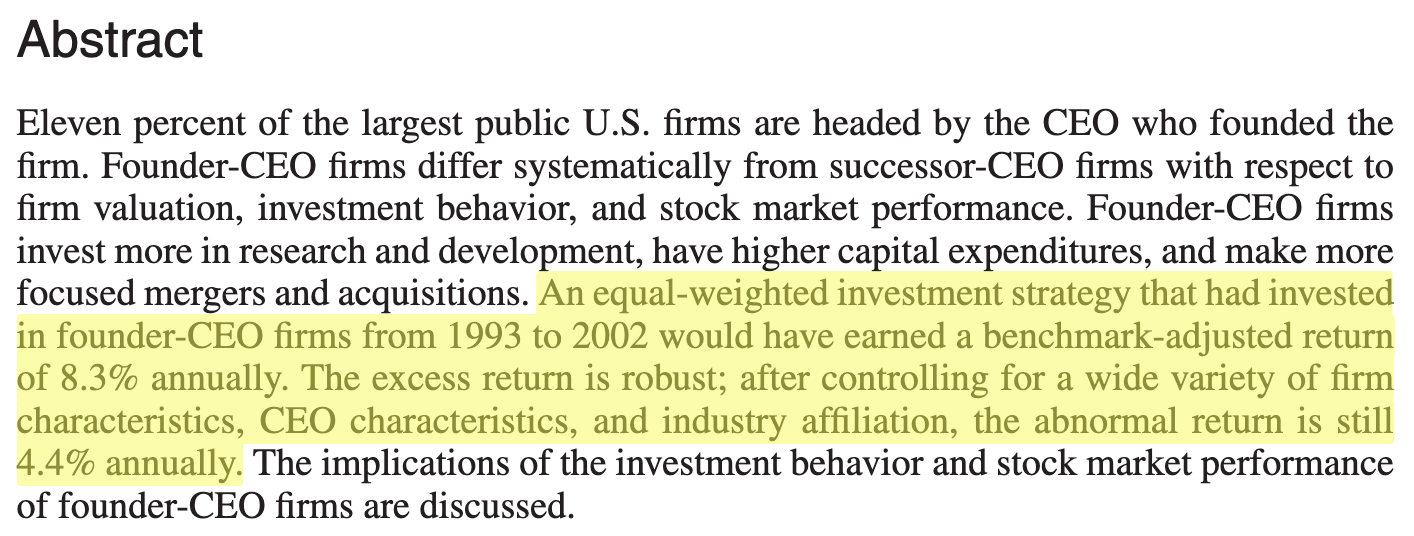
12) Founder/Owner-Operator/Family Run
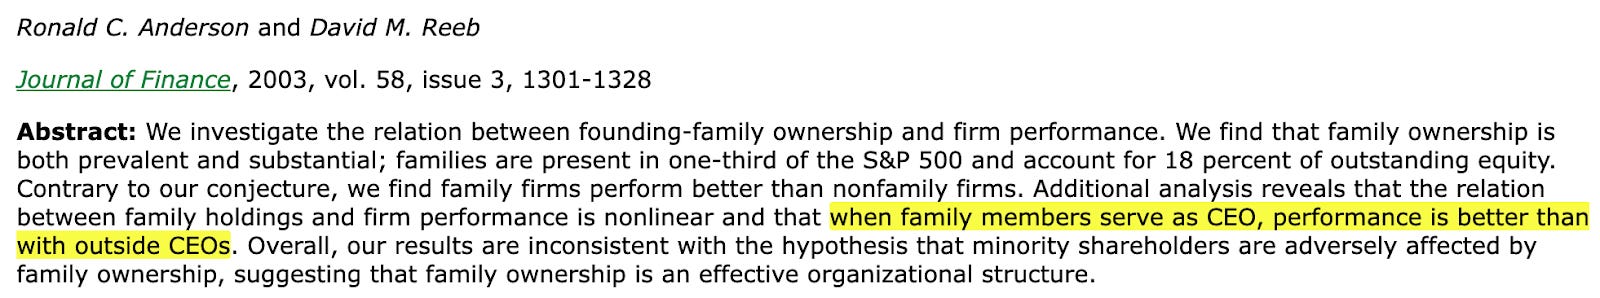
Finally, the dozenth key to outperforming per the data is founder/owner-operator/family run characteristics.
When these people are in charge, the businesses and stocks perform better:
And by a good clip too – we can add about 4.4% annually by limiting ourselves to these stocks:
This makes sense, as these people care more about the business, rather than their own careers.
Alrighty!!
That is the Guide to the Data on Outperformance!!
Next week we will start attacking the stocks every which way to screen the very best.
And we will also apply a lot of thematic investing – I have some ideas for broader themes, and am looking forward to seeing what stocks shake out in these areas.
So if this is a bit overwhelming – never fear!!
We will continue to attack the market together, looking for just the very best of the best. Both as the data instructs us, and as opportunities seem to present themselves in the market.
Also!!
Now that we have all of this fleshed out, I will start up videos again, because we have a clear mission and guide now.
I hope you enjoyed this and got a lot out of it my investing friend. I look forward to seeing you in the Discord: