

The REAL Highest Returning Stocks in the Market (And the One Stand Out)
This is key to us outperforming my friend, which we can only do for ourselves!!

Hello Investing Friend!!
I hope you are well!!
If not, I have a special project for us today!!
As you know, we can only outperform for ourselves – managers cannot do this for us.
And as you also know, outperforming is so very worthwhile:
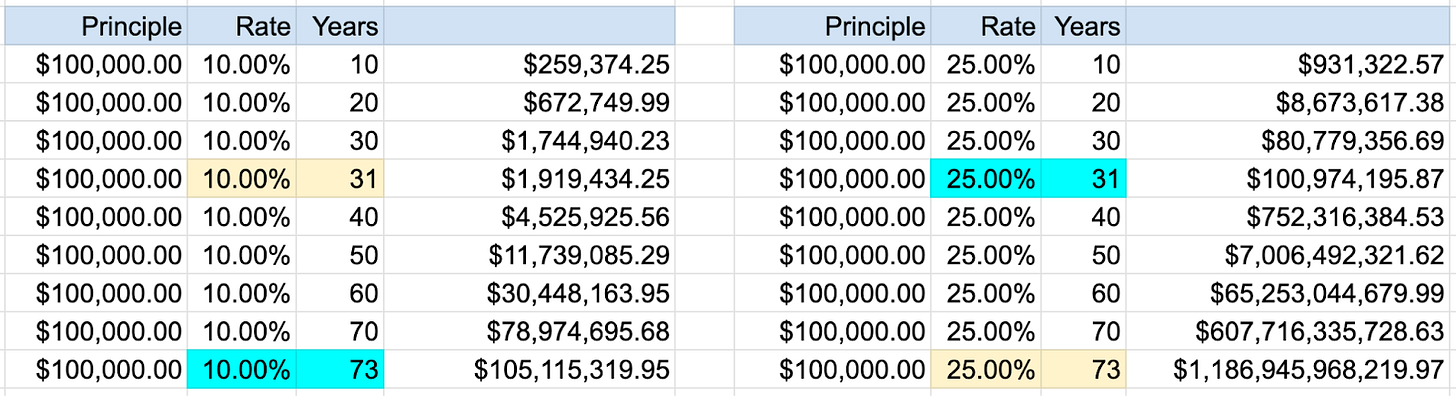
Compounding at high rates is simply magic, and can make all of our financial dreams come true.
And as you further know – we are already doing this together, compounding at 35% annually (22.7% after 8.25 months vs 6.4% for the S&P 500).
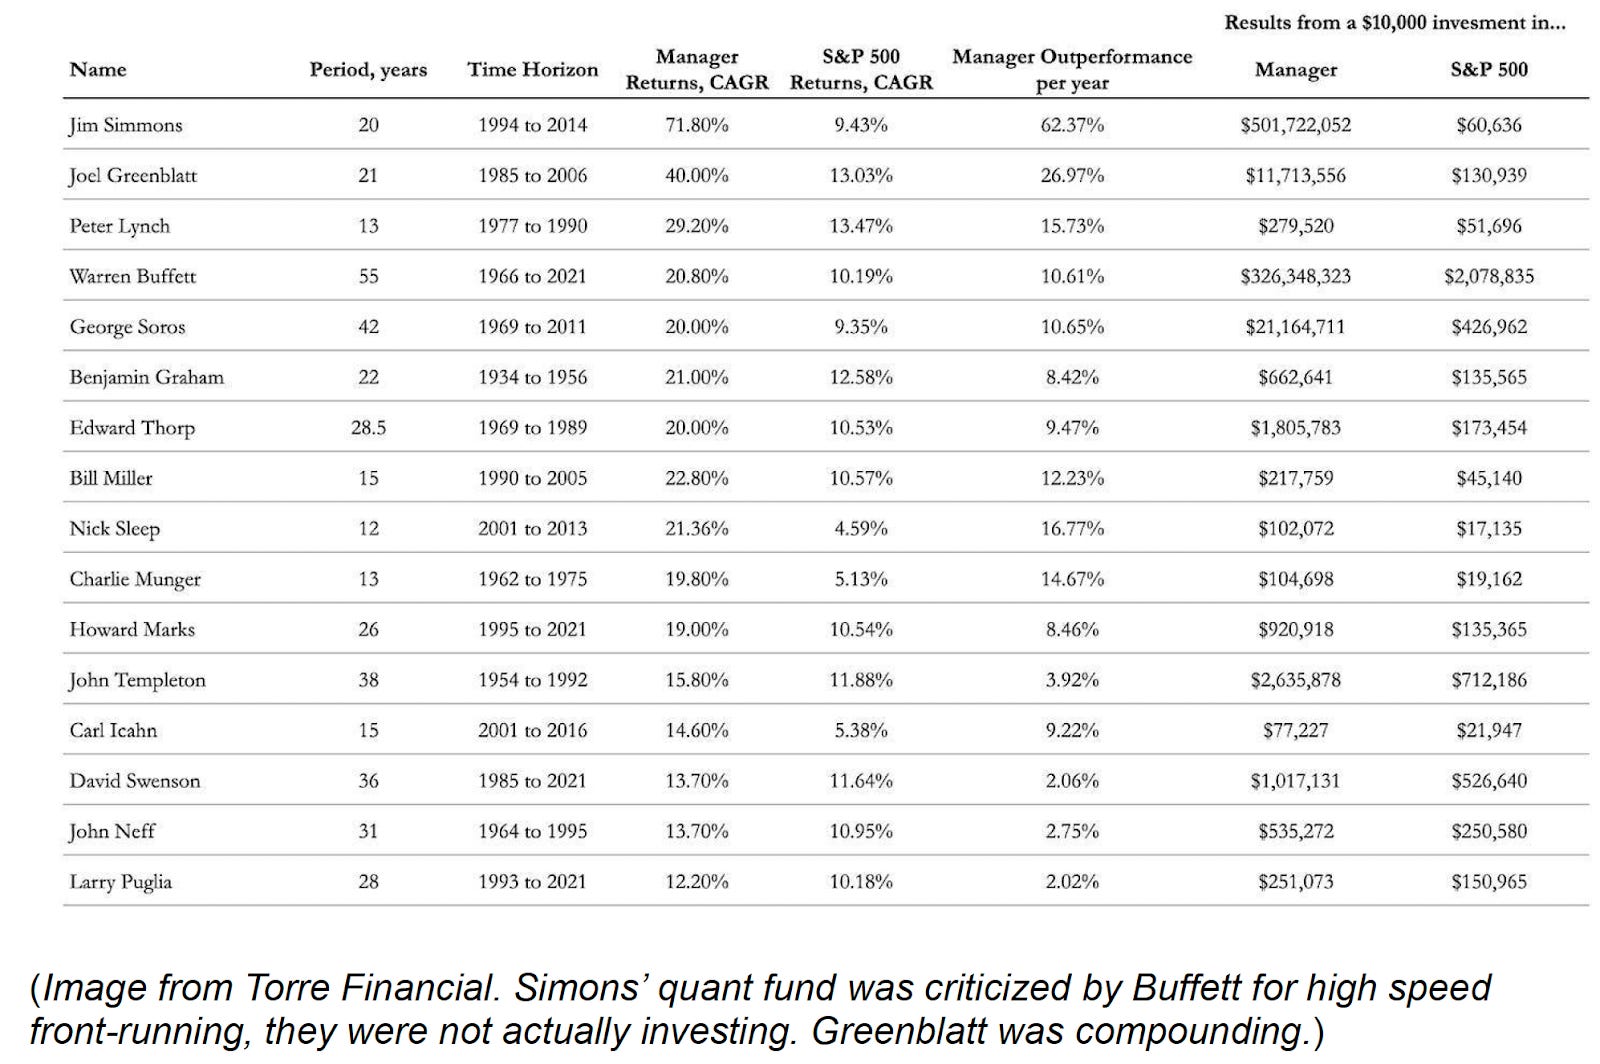
We are achieving our goals my investing friend, doing what the greats have done based on sound investing principles and sweet, sweet data:
But we are not resting on our laurels.
We are now writing a neat-and-sweet definitive guide for us on the data of outperformance – and identifying the stocks that have the right stuff, ahead of time.
The project is a little large, so today we are focusing solely on one of the most important pieces.
For today you see, we are focusing squarely on the data of high returns.
This is one of the most fundamental things for us to understand – companies earning high returns for a long time can have stocks with high compounding rates for a long time.
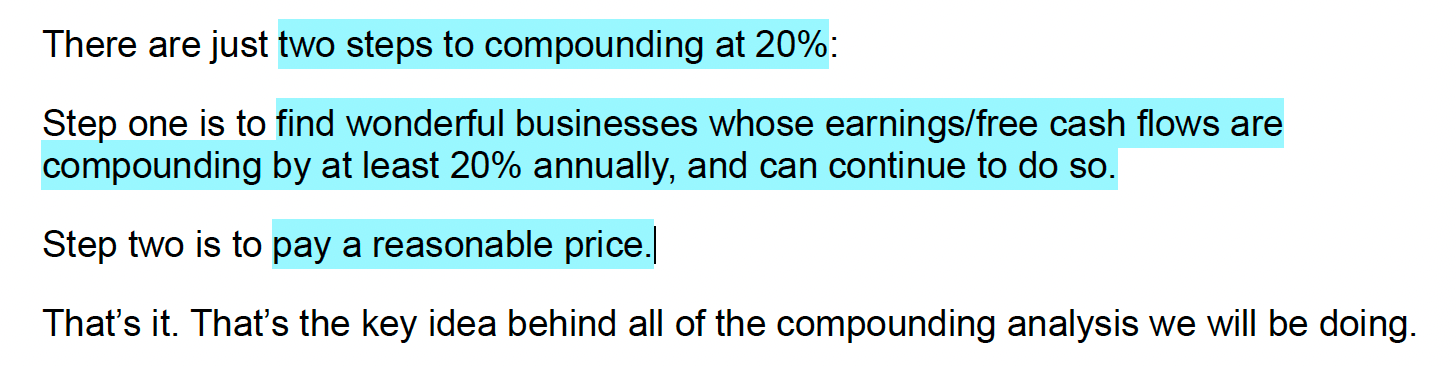
As we said when we launched our portfolio:
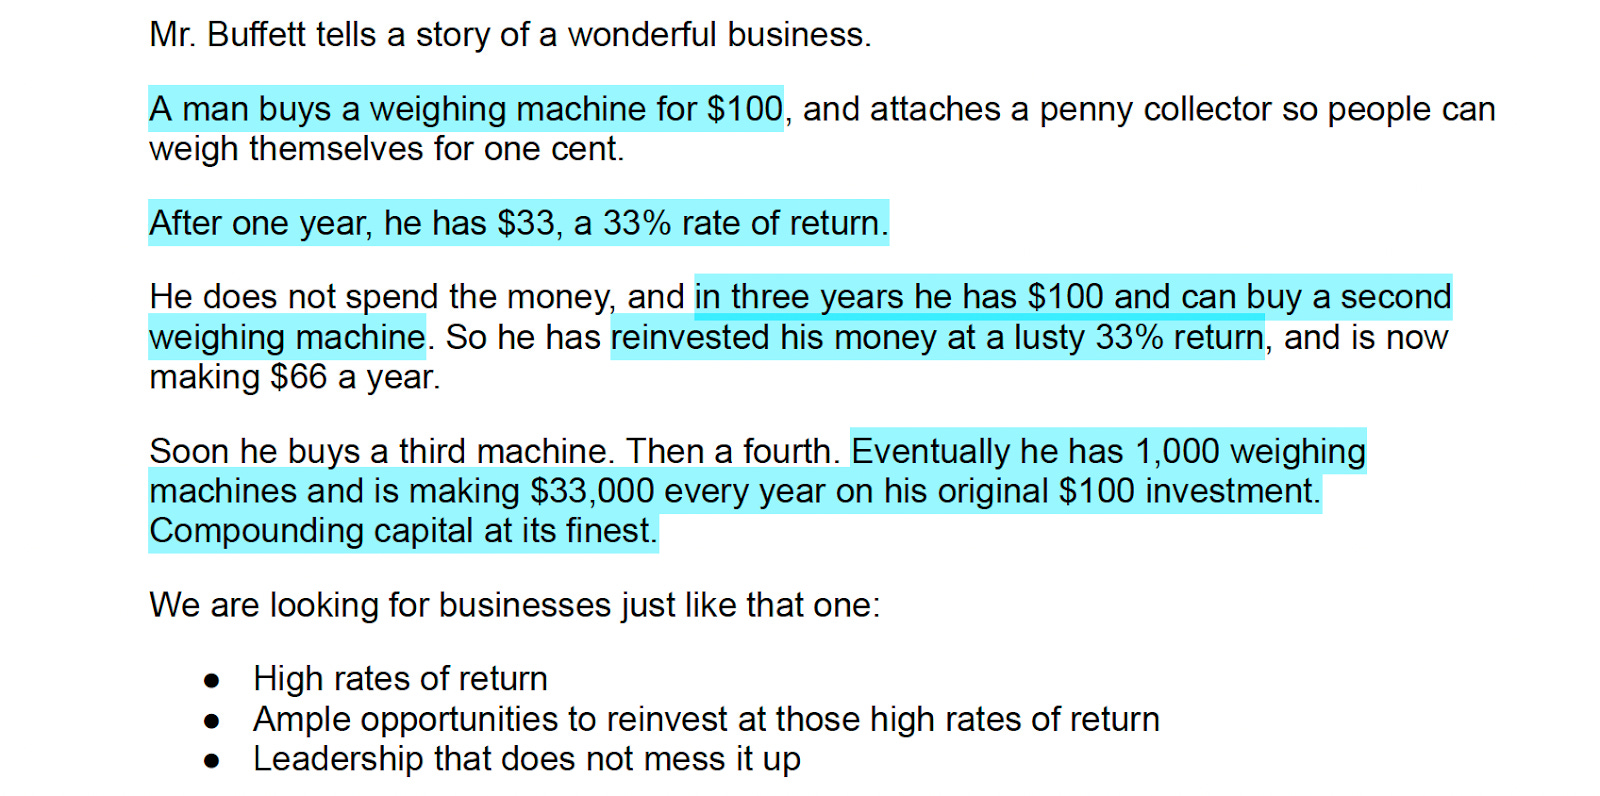
And as we illustrated with a story from uncle Warren:
“OK!!” you say. “I’m in on this high return stuff…so where do we see these stocks’ returns so we can find the ones with high returns?”
Well, the basic answer is by looking at the Return on Invested Capital metric. That’s what it’s for. In a simpler world, if it were over 20%, then we are in business.
BUT.
There is so much more to incorporate into our calculations, if we want to get closer to the real picture of how a company is doing.
Specifically:
Free Cash Flow – FCF is generally a better metric for “real” earnings than net income. Companies that excel in FCF can have hidden high returns. Generally, if FCF is steadily twice what net income is, we can go ahead and double the ROIC as well. Also, Stock Based Compensation (SBC) makes FCF look better than it is. So we should subtract it from the FCF to get closer to the “real” returns.
Research & Development – R&D represents directly reinvesting into the business, hopefully at high returns. However, these dollars are spent before earnings/FCFs are calculated, so companies can avoid taxes while growing the business. So whereas SBC makes FCF look artificially good and should be subtracted, R&D makes FCF look artificially bad and should be added back.
Reinvestment Allocation – If a company has a 25% ROIC, but pays out half of its earnings in dividends/buybacks, then ROIC must be cut in half, too. This is why we don’t want companies that are returning cash to us – we want them reinvesting every dollar at high rates.
Growth in Invested Capital – A company has a pile of capital, and ROIC measures the returns on that capital. But what if that pile of capital is growing? That also increases returns, but ROIC misses it. So if ROIC is 15%, but the capital base grows 50% in a year, we can juice those returns by 50%, too. So in this example adjusted ROIC would be 22.5%.
Incremental Capital – ROIC measures how returns are doing on the invested capital in the company. But it could be that a company has a mature and profitable business, showing a high ROIC. But that company might be having trouble keeping the party going – finding new places to invest that are as good as its base business. So a company can keep a high but slowly melting ROIC for a long time, and investors might not notice that the new reinvestment endeavors are not as lucrative as the old business. So for this, we don’t look at Return on Invested Capital, but Return on Incremental Invested Capital, or ROIIC.
Financial Companies — These companies can have funny return metrics, so we are not tackling them here today (basically ROE is better than ROIC here, but we are lacking supporting data for ROE like incremental returns for example)
Let’s do it!!
I have expanded the Possible Outperformers portfolio to 490 names, and done the calculations on all of them, to find the REAL highest returning businesses for us.
There are a number of noteworthy and pause-inducing ones.
But there are five stocks in particular that the “hidden” data seems to be signaling loudly to us.
And one in particular that passes all tests, and screams “buy me”.
The link to the spreadsheet with all of the delicious data is…